What the equity multiplier is, how to calculate it, and why it matters for understanding leverage, capital structure, and ROE.
What the equity multiplier is, how to calculate it, and why it matters for understanding leverage, capital structure, and ROE.


Imagine you're at a poker table with $1,000 in chips.
The guy next to you has the same $1,000, but he's somehow controlling $4,000 worth of bets.
How?
He borrowed $3,000 from the house.
When he wins, he wins big. When he loses... well, let's just say the house always remembers.
That poker player?
He's basically every company using financial leverage.
And the equity multiplier?
It's the mathematical fortune teller that reveals exactly how much financial gambling is really going on behind those polished earnings reports.
Here's the thing most business textbooks won't tell you:
The equity multiplier is like a financial X-ray machine that sees through corporate spin and reveals the raw truth about risk.
Some companies use it like a precision instrument to amplify returns. Others wield it like a financial chainsaw, and we all know how that usually ends.
The equity multiplier is essentially a "leverage lie detector" that answers one crucial question:
For every dollar the owners actually put into this business, how many dollars is the company actually controlling?
The formula is deceptively simple:
Equity Multiplier = Total Assets ÷ Total Equity
But here's where it gets interesting. This ratio is like a corporate DNA test that reveals a company's true personality:
But unlike your typical financial ratio that sits quietly in spreadsheets, the equity multiplier has an attitude.
It's the difference between a company that owns its destiny and one that's basically renting its future from creditors.
Think of it this way:
If a company has an equity multiplier of 1.0, the owners control everything they touch—it's like owning your house outright.
But when that multiplier hits 4.0?
The owners control four times more assets than they actually own.
It's like leveraging your $100,000 house to control a $400,000 real estate empire. Brilliant when property values rise, catastrophic when they don't.
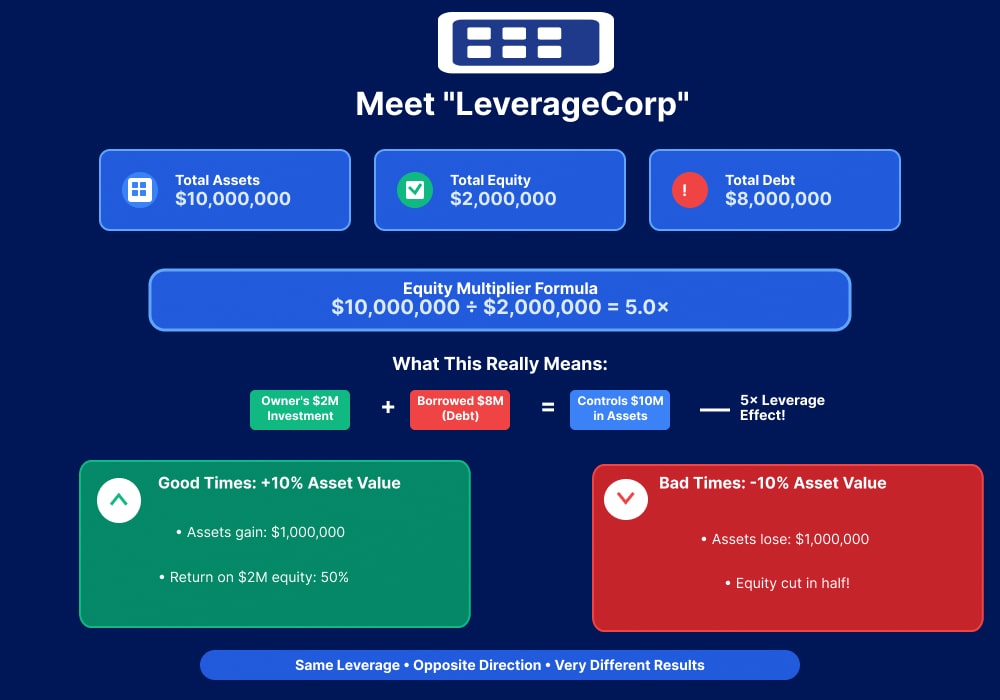
Let's crack open the hood with a real example that'll make this crystal clear:
Meet "LeverageCorp" :
Equity Multiplier = $10,000,000 ÷ $2,000,000 = 5.0
This means LeverageCorp's owners put in $2 million but somehow control $10 million worth of Assets.
The other $8 million?
That's borrowed money.
They're essentially running a $10 million operation on a $2 million down payment.
So?
If LeverageCorp makes a 10% return on those assets, they earn $1 million on their $2 million investment—that's a 50% return on equity.
Financial leverage just turned a decent return into a spectacular one.
But if those assets lose 10% of their value?
LeverageCorp loses $1 million, which wipes out half their equity.
Same leverage, opposite direction, much uglier results.
Finding these numbers isn't rocket science, but it's surprisingly easy to mess up:
The big number at the top of the balance sheet. It's everything the company owns, claims to own, or wishes it owned.
Hiding at the bottom of the balance sheet, sometimes disguised as "Stockholders' Equity" or "Shareholders' Equity."
This is what the owners would theoretically get if they liquidated everything and paid off all debts (assuming they could actually sell everything for book value, which is adorably optimistic).
Pro tip: If you can't find these numbers, you either need glasses or you're looking at an income statement. They're different documents.
Companies with equity multipliers above 3.0 are basically the financial equivalent of that friend who buys a Lamborghini with a credit card. They're betting big, living dangerously, and either heading for spectacular success or spectacular failure.
The Good News:
The Bad News:
Companies below 2.0 are the financial equivalent of your grandmother—conservative, careful, and probably hiding cash in multiple mattresses just in case.
The Benefits:
The Trade-offs:
Here's where things get spicy: what's "normal" varies wildly by industry, like fashion trends that make no sense to outsiders.
Run around with 4.0-5.0 multipliers because they've got massive power plants and predictable cash flows. It's like having a money-printing machine that requires a billion-dollar investment upfront.
Typically hover around 1.5-2.5 because their main assets walk out the door every evening and hopefully come back the next morning. Hard to collateralize talent.
Can push 6.0+ because property makes excellent collateral, and rent checks arrive monthly like clockwork (in theory).
Can hit 10.0+ because, well, their entire business model is leverage. They're basically professional money borrowers who got really good at it.
Here's where the equity multiplier reveals its true superpower. It's one-third of the holy trinity of financial analysis called DuPont analysis:
ROE = Net Profit Margin × Asset Turnover × Equity Multiplier
Think of it as the financial equivalent of a three-part harmony where each component amplifies the others.
Same operations, same profitability, but Leverage Larry's shareholders get 75% higher returns purely through financial engineering.
The trade-off?
Larry's company is one bad quarter away from a very uncomfortable conversation with their banker.
This is why the equity multiplier isn't just a number—it's a strategic weapon that can transform mediocre businesses into shareholder darlings or turn solid companies into financial disasters.
Let's settle this once and for all with a comparison that actually makes sense:
These ratios are mathematically connected like a financial family reunion:
Understanding these relationships is like having financial superpowers—you can convert between ratios faster than a CFO can say "EBITDA."
Let's say you're evaluating two manufacturing companies for investment.
Company A has an equity multiplier of 2.1, while Company B clocks in at 4.8.
Company B's numbers look more exciting, but Company A might be the tortoise in this particular race.
Smart investors use equity multiplier trends to spot companies that are either:
Then, they can make an informed decision about the company by looking at its capital structure, Cap Table, and Equity Multiplier impacts.
Banks treat equity multipliers like credit scores on steroids.
A small business with a rapidly climbing equity multiplier might find its next loan application about as welcome as a tax audit.
Lending covenants often include maximum equity multiplier thresholds because banks learned (the hard way) that highly leveraged companies have a nasty habit of becoming former companies.
Before major acquisitions or expansion projects, CFOs model how additional debt will affect their equity multiplier. It's like financial scenario planning that could determine whether the company thrives or becomes a cautionary tale in business school textbooks.
Consider a growing tech company contemplating a $50 million acquisition:
The equity multiplier treats all debt equally, which is like saying all spiders are the same size.
A company with 3.0× leverage in long-term, fixed-rate debt faces very different risks than one with 3.0× leverage in short-term, variable-rate debt.
Two very different scenarios where the context and details matter.
High equity multipliers only create value when companies earn more than they pay for debt.
A company with a 4.0× equity multiplier earning 5% returns while paying 7% interest is essentially paying for the privilege of destroying shareholder value.
It's financial alchemy in reverse.
Different accounting treatments can make equity multiplier comparisons as reliable as weather forecasts.
Asset revaluations, goodwill impairments, and equity write-downs can create temporary spikes that have nothing to do with actual leverage changes.
Seasonal businesses add another layer of complexity.
A retail company's equity multiplier might spike during inventory build-up periods and plummet after holiday sales, creating the illusion of leverage volatility when it's really just business rhythm.
Managing equity multipliers is like tuning a race car—too little leverage and you're leaving performance on the table; too much and you're heading for a spectacular crash.
Complex capital structure decisions are like performing surgery—theoretically possible to do yourself, but probably not advisable.
Fractional CFO services can help analyze optimal equity multiplier levels without the full-time CFO price tag.
Financial planning professionals can model various scenarios to determine appropriate leverage ranges, while strategic coaching can help develop frameworks for ongoing capital structure optimization.
Want to know if your leverage is driving healthy returns?
Understanding your optimal equity multiplier isn't just about crunching numbers—it's about finding that sweet spot where growth meets stability.
Whether you need help optimizing your capital structure or want to understand what your current ratios really mean, McCracken Alliance transforms complex financial analysis into actionable strategy.
Schedule a consultation and discover how to use financial leverage as a precision tool rather than a blunt instrument. Your shareholders (and your sleep schedule) will thank you.
It really depends entirely on the industry. trytry. Typically, over 3 is considered high and under 2 is considered low. Utilities can handle 5.0+, while software companies might get nervous above 2.5. Context is everything.
Generally, yes, but it's nuanced. A utility with a 4.5× multiplier might be safer than a restaurant chain with 2.8×. Predictable cash flows can support higher leverage than volatile earnings.
It's one piece of the puzzle, but not a crystal ball. Rapidly increasing equity multipliers combined with declining profitability? That's when things get interesting (and not in a good way).
For public companies, quarterly, when new financial statements come out. For private companies, whenever you're making major financial decisions or your banker asks for updated financials.
That means you have negative equity, which is the financial equivalent of being underwater on your mortgage, except worse. Time to call professionals—the kind that specialize in crisis management.


.svg)