ROA reveals how efficiently companies squeeze profit from assets. Same revenue, different returns? It's about asset utilization efficiency
ROA reveals how efficiently companies squeeze profit from assets. Same revenue, different returns? It's about asset utilization efficiency


Think about two of the most well-known companies in your industry.
Your competitors.
It's good to know your competitors, right?
They might generate identical revenue, but one delivers 15% returns to investors while the other barely scrapes by at 3%.
You'd want to know why, so that you could mimic or beat out the former and avoid the latter.
So what's the difference?
It's not luck.
And it's not market timing, or even superior products, or the best marketing.
It's how efficiently they squeeze profit from every dollar of assets they own.
It's how good of a Return they can generate for every dollar of assets they own.
Return on Assets (ROA) measures how efficiently a company converts its assets into profit.
Simply put, it tells you how many cents of profit your business generates for every dollar of assets it owns.
ROA serves as a key metric for evaluating management effectiveness and operational efficiency.
It cuts through the noise of revenue growth and margin discussions to answer the fundamental question: "Are we getting maximum value from the resources we've invested in?"
The business significance runs deeper than simple profitability measurement.
Higher ROA indicates superior asset utilization, more efficient operations, and stronger financial performance relative to the capital deployed.
Companies with consistently high ROA typically enjoy competitive advantages that are difficult to replicate—they've optimized their asset base to generate more profit with less investment.
From a strategic perspective, ROA reveals whether growth is actually creating value or just consuming capital. A company that doubles revenue while tripling assets might look successful on top-line metrics, but ROA exposes the underlying efficiency erosion that could signal trouble ahead.
Think about it: you could own a $10 million manufacturing facility that generates $500,000 in annual profit, or you could own a $2 million operation that generates the same $500,000.
Both hit the same profit target, but one delivers 250% better asset efficiency.
Guess which CFO gets invited to present best practices at industry conferences?
The companies that master ROA don't just manage assets—they weaponize them. They've cracked the code on turning fixed costs into profit engines, and they use this insight to make smarter acquisition decisions, optimize operations, and build competitive moats that compound over time.
So now that you understand what ROA measures, let's dig into the actual math—because once you see how simple this calculation is, you'll wonder why more companies aren't obsessing over it.
The Return on Assets calculation follows a straightforward formula:
ROA = Net Income / Average Total Assets
You could use a Return on Asset Calculator to easily find out your ROA, or even easily create a Return on Asset Formula on a metrics document in Excel.
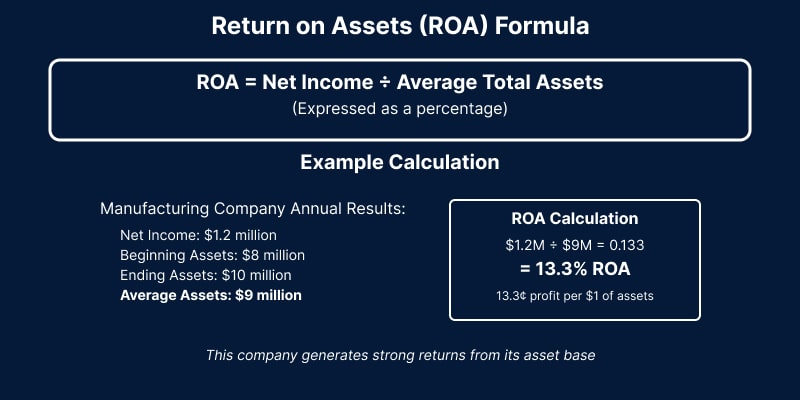
Net Income represents the company's profit after all expenses, taxes, and interest payments.
Average Total Assets is calculated by adding beginning and ending total assets for the period, then dividing by two—this provides a more accurate picture than using a single point-in-time asset value.
A manufacturing company reports $1.2 million in net income for the year.
Their total assets at the beginning of the year were $8 million, and $10 million at year-end, making the average total assets $9 million.
Their ROA equals $1.2 million ÷ $9 million = 13.3%.
This means the company generated 13.3 cents of profit for every dollar of assets—a solid performance that indicates efficient asset utilization.
Now, if you're looking at this calculation thinking, "I definitely should know my net income and total assets number, but honestly couldn't tell you what they are right now," don't panic.
You're not the first founder to realize that the financial fundamentals they assumed "someone else was tracking" are critical strategic intelligence.
The good news? Getting clarity on these numbers is usually easier than you think, and the insights you'll gain are worth the effort.
But before we get into how to improve your ROA, let's talk about what constitutes "good" performance, because without context, that 13.3% number is just math.
ROA performance varies dramatically across industries, reflecting different capital requirements, business models, and competitive dynamics.
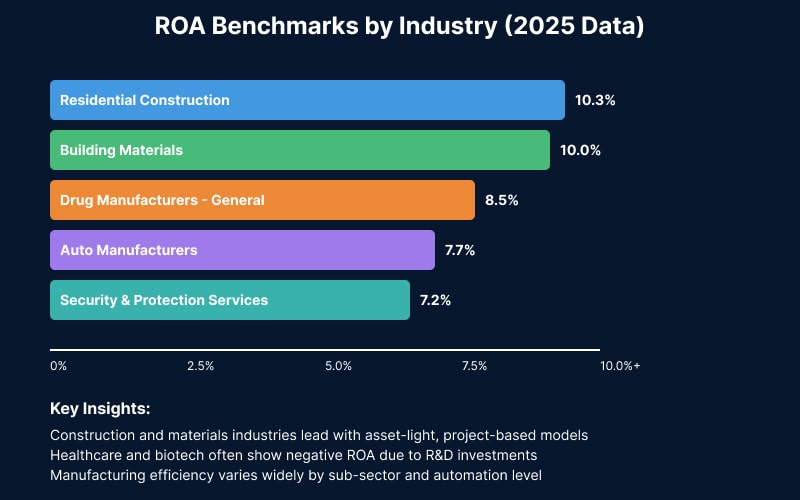
At the high end, Residential Construction achieves 10.3% ROA because successful projects generate substantial profits relative to the assets deployed. These companies typically operate with lean asset bases, using project financing and subcontractor networks rather than owning heavy equipment.
At the low end, industries like Biotechnology show negative ROA (-42.2%) due to massive R&D investments that may not generate returns for years.
Medical Devices (-25.3%) face similar challenges with long development cycles and regulatory approval processes that require substantial upfront investment before any revenue materialization.
This is why industry context matters substantially.
The massive spread—from +10.3% to -42.2%—illustrates why benchmarking against industry peers is critical.
A 3% ROA might represent exceptional performance for a utility company but signal serious problems for a software firm. Smart CFOs focus on industry-relative performance rather than absolute standards.
Startups often show negative or extremely low ROA during early stages due to heavy upfront investments in product development, team building, and market entry, and that's completely normal.
Unlike established companies optimizing existing operations, startups are deliberately trading current asset efficiency for future growth potential, making ROA more useful as a trend indicator than an absolute performance metric during the first few years.
Understanding your industry's typical range provides context for evaluating performance and setting realistic improvement targets. But remember—these are averages, and the best companies in every industry significantly outperform their peers.
ROA provides valuable insights, but it becomes most powerful when analyzed alongside complementary financial metrics that reveal different aspects of business performance.
One highlights asset efficiency, and the other shareholder returns.
They are separated by profitability and operational efficiency.
How Smart CFOs Combine Metrics:
The reality is that most growing companies track these ratios sporadically—usually when preparing for board meetings or investor updates. But the companies that pull ahead consistently monitor these metrics as operational tools, not just reporting requirements. They've figured out that ROA trends often predict performance problems months before they show up in revenue or profit numbers.
Speaking of which, let's talk about how to improve your ROA—because understanding the metric is one thing, but moving the needle is where the real value lies.
Improving ROA requires a systematic approach targeting both sides of the equation: maximizing profit while optimizing asset deployment. Smart CFOs identify the highest-impact improvement areas specific to their business model and industry dynamics.
Focus on operating expense optimization without compromising growth, automate manual processes to reduce labor costs, renegotiate supplier contracts for better terms, and eliminate redundant systems that add cost without value.
Identify and improve underperforming assets, consolidate facilities to maximize space efficiency, upgrade equipment to increase throughput, and divest non-core assets that don't drive competitive advantage.
Streamline processes to generate more output from existing assets, reduce manufacturing downtime and increase production velocity, optimize capacity utilization across service businesses, and enhance employee productivity through better systems and training.
Make smarter capital allocation decisions based on ROA impact, prioritize projects with proven returns over asset accumulation, avoid investments that don't drive proportional profit increases, and evaluate all major expenditures through an ROA lens.
This is exactly where Fractional CFO expertise makes the difference.
Rather than hiring a full-time executive you might not be ready for, a fractional CFO brings the strategic financial leadership to implement these ROA improvements systematically.
They have the experience to coordinate across departments, the analytical skills to identify the highest-impact optimization opportunities, and the bandwidth to focus on asset efficiency while you run the business.
It's the kind of specialized financial leadership that transforms ROA from a quarterly calculation into a daily management advantage.
But before you start optimizing, you need to know when ROA is telling you something's seriously wrong. Let's look at the red flags that should have you digging deeper.
Low ROA doesn't always indicate poor performance, but certain patterns should trigger immediate investigation and corrective action.
Companies accumulate assets faster than they can productively deploy them, often caused by poorly planned acquisitions or over-investment in facilities. This manifests as gradually declining ROA despite stable profits, plus cash hoarding that generates minimal returns.
Margins compress faster than assets can be optimized, signaling competitive pressure or cost structure problems. ROA decline often precedes more visible performance problems and indicates loss of pricing power in the marketplace.
Historical advantages become competitive liabilities as traditional retailers face e-commerce competitors and asset-heavy manufacturers confront asset-light disruptors. This requires fundamental business model adaptation. Otherwise, competitors can snatch up market share in an instant.
Temporary dips during planned expansion phases, economic downturns affecting the entire industry, and strategic investments with longer payback periods.
Persistent deterioration over multiple quarters, performance significantly below industry norms, ROA decline without a clear strategic explanation, and asset growth outpacing profit growth consistently.
Smart CFOs use ROA trends as early warning systems, investigating declines before they become crises and taking corrective action while options remain available.
Forward-thinking CFOs leverage ROA analysis to guide major strategic decisions and resource allocation choices that shape long-term company performance.
Evaluate potential investments based on ROA contribution rather than just growth, reject expansion opportunities that would dilute overall returns, prioritize technology investments that improve asset productivity using frameworks like CAPM for risk-adjusted returns, and make data-driven choices about facility expansion vs. optimization.
Identify acquisition candidates that enhance rather than dilute asset efficiency, target companies with superior ROA for operational best practice transfer, avoid deals that would significantly reduce combined entity ROA, and structure transactions to preserve or improve asset efficiency. Many companies find that specialized M&A financial expertise becomes crucial during deal evaluation to maintain ROA focus throughout the transaction process.
Align management incentives with shareholder value creation, set ROA targets that encourage efficient growth over growth for its own sake, create compensation frameworks that reward asset optimization, and use scenario planning to model how different strategic decisions will impact future ROA performance under various market conditions.
Most companies use ROA reactively.
They’ll calculate it for annual reports or investor presentations, but not integrate it into actual decision-making processes.
The companies that pull ahead treat ROA as a real-time management tool, using it to evaluate everything from hiring decisions to facility investments.
And that brings us to the most sophisticated application of ROA—using it as a daily management framework rather than just a quarterly calculation.
The most sophisticated finance leaders use ROA as more than a performance metric.
They deploy it as a strategic management framework that drives daily operational decisions and long-term planning processes.
They've figured out that asset optimization isn't a one-time project but a continuous management discipline that separates industry leaders from industry participants.
If you're starting to realize that ROA deserves more strategic attention in your business, or if you're struggling to translate financial metrics into actionable operational improvements ,you're facing a challenge that many growing companies encounter.
There comes a point where financial analysis becomes too important and too complex to handle as a side project. That's often when bringing in experienced financial leadership makes the difference between understanding your numbers and using them to drive performance.
Understanding your ROA is just the beginning. The real value comes from consistently improving it as part of a comprehensive financial planning and analysis approach that turns financial metrics into competitive advantages.
McCracken Alliance specializes in connecting companies with fractional and interim CFOs—both in-person and virtual—who can implement systematic ROA improvement strategies, build financial planning frameworks, and transform your financial metrics from reporting tools into strategic weapons.
Ready to unlock the hidden profitability in your assets?
Contact McCracken Alliance today to discuss how experienced CFO leadership can optimize your ROA and drive sustainable growth.
A good ROA depends on your industry. Technology companies often achieve 8-15%, while capital-intensive industries like manufacturing might target 3-6%. The key is benchmarking against industry peers rather than absolute standards.
ROA measures profit relative to total assets, while ROI typically measures returns on specific investments. ROA provides a company-wide efficiency metric, while ROI evaluates individual projects or initiatives.
Extremely high ROA might indicate under-investment in growth opportunities or unsustainable cost-cutting that could hurt long-term competitiveness. Balance is key—optimal ROA supports both efficiency and strategic positioning.
Most companies calculate ROA quarterly for trend analysis, though monthly calculations can provide earlier insight into performance changes. The key is consistent measurement that enables meaningful comparison over time.


.svg)