What leverage ratios are, how to calculate them, and how they help assess debt levels, risk, and financial health in businesses and banks.
What leverage ratios are, how to calculate them, and how they help assess debt levels, risk, and financial health in businesses and banks.


You're sitting across from a potential lender, watching their expression shift as they scan your company's financial statements.
The numbers look good on the surface—solid revenue, decent profits, growing assets.
But then they pull out a calculator, punch in a few figures, and suddenly their enthusiasm cools considerably.
What just happened?
They calculated your leverage ratios, and those ratios just told a very different story about your company's financial health than the glossy numbers suggested.
Leverage ratios are the financial world's truth serum.
While other metrics can paint rosy pictures, leverage ratios cut straight to the core question that keeps bankers, investors, and CFOs awake at night:
How much debt is this company really carrying, and can it handle it?
Understanding leverage ratios isn't just about satisfying curious lenders—it's about mastering one of the most critical tools for measuring financial risk, planning growth strategies, and making informed decisions about your company's capital structure.
A leverage ratio measures how much debt a company uses relative to its equity, assets, or earnings capacity.
Think of it as a financial x-ray that reveals the underlying bone structure of your business financing—showing exactly how much you're relying on borrowed money versus your own capital to fund operations and growth.
But leverage ratios are more than just something learned in Finance 101.
They are powerful indicators and early warning signs that help signal financial distress, benchmark industry standards, and guide a company’s capital allocation decisions.
CFOs should pay particular attention to leverage ratios.
Why?
Because they help to answer some fundamental financial questions :
Are we taking on too much debt?
How does our leverage compare to competitors?
What's our capacity for additional borrowing?
All this being said, the answers to these questions, found with the help of leverage ratios, form the cornerstone of financial risk management.
These factors directly affect every aspect of growth capital financing and dividend strategies.
Leverage ratios are utilized by investors to determine risk/return profiles before making an investment.
Leverage can increase returns when times are good, but can increase losses when times are not so good either. It’s vital to comprehend this while allocating portfolios or while valuing companies.
Leverage ratios receive so much attention from lenders that they could well be described as
A company with deteriorating leverage ratios could face higher rates of interest or more stringent loan covenants, or even loan rejections.
By contrast, firms with robust leverage positions tend to benefit from more favorable debt facilities.
Leveraged ratio measures of risk are applied by regulators, especially in banking, to determine if banks hold enough capital against their system risks.
The Basel III framework, for example, requires banks to maintain minimum leverage ratios to prevent excessive risk-taking that could threaten the broader financial system
Leverage ratios come in several flavors, each offering different perspectives on debt usage and financial risk:
The debt-to-equity ratio reveals how much debt a company is using compared to how much stock is outstanding (equity). It reveals how leveraged or dependent on debt financing the company is.
It’s useful to note that this ratio can easily be used to gauge industry differences when it comes to sourcing funds for operations.
Technology firms pay lower debt/equity (0.2 to 0.8) because they don’t utilize more assets or infrastructure much at all; for example, a 1.5 to 2.5 ratio for utility firms because they generate cash constantly.
The debt ratio reveals how much of the assets of the company can be debt-financed rather than equity-financed. A debt ratio of 0.4 implies that 40% of assets can be debt-financed while 60% can be equity-financed.
The debt ratio measures how well management can utilize working capital and the debt management capabilities of any company. Companies with a lower debt ratio can opt for more debt capital even if unexpected adverse events arise.
The equity multiplier reveals how many dollars of assets a firm can control with every dollar of equity. Higher multipliers indicate more leverage; this could lead to higher returns, but could increase risks too.
“This ratio works well with DuPont analysis to demonstrate how leverage has an effect on ROE because: ROE = Net Profit Margin × Asset Turnover × Equity Multiplier.”
It is otherwise known as the “interest coverage ratio.” It reveals how many times the company can service or cover its interest expenses with its present operating income.
It translates to saying that if the ratio is 5 times, this implies that the company’s operating income is five times larger than its interest expenses.
It’s an important ratio when considering cash flow management and how well companies can service debt at times when their income may be significantly lower.
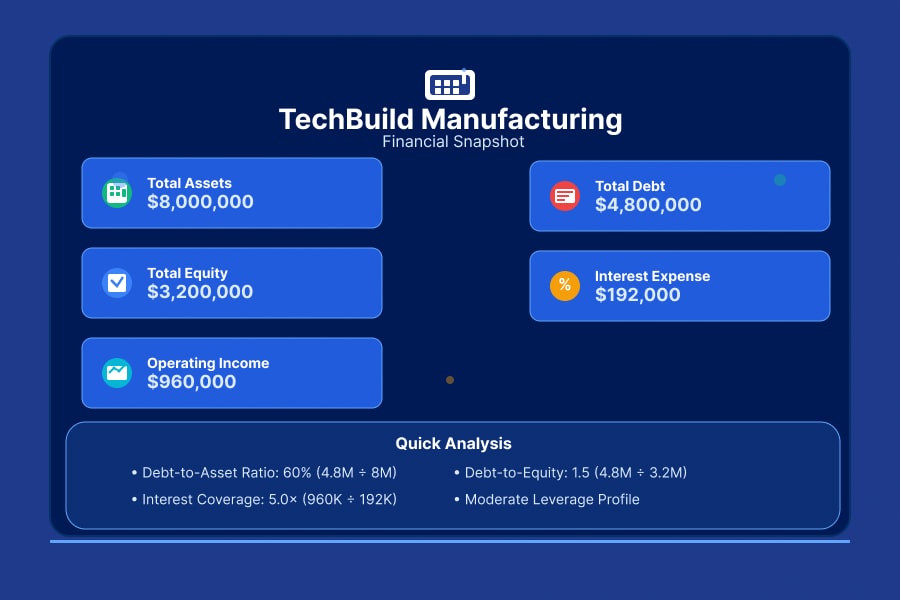
Now, let’s discuss leverage ratio calculations so you’re able to more clearly assess what’s going on. We can examine TechBuild Manufacturing, an M-size industrial company.
TechBuild's Financial Snapshot:
Formula: Total Debt ÷ Total Equity
TechBuild's Calculation: $4,800,000 ÷ $3,200,000 = 1.5
TechBuild has $1.50 of debt for every dollar of equity. This moderate leverage suggests balanced financing that's neither overly conservative nor dangerously aggressive for a manufacturing company.
Formula: Total Debt ÷ Total Assets
TechBuild's Calculation: $4,800,000 ÷ $8,000,000 = 0.60
Approximately 60% of TechBuild’s assets are financed with debt and 40% with equity. It’s fairly leveraged capital structure, but not abnormal for a capital-intensive manufacturing company.
Formula: Total Assets ÷ Total Equity
TechBuild's Calculation: $8,000,000 ÷ $3,200,000 = 2.5
TechBuild has assets of $2.50 for each dollar of stock. While this leverage ratio of 2.5:1 can increase potential gains, it can increase risk as well.
Formula: Operating Income ÷ Interest Expense
TechBuild's Calculation: $960,000 ÷ $192,000 = 5.0
TechBuild can cover interest payments five times over with current operating income, indicating comfortable debt servicing capacity with a reasonable safety margin.
TechBuild is balancing growth with prudence—and so far, doing it well. With figures like debt-to-assets at 0.60 and debt-to-equity at 1.5, they're using debt well without going wild with it either.
With an interest coverage ratio of 5.0× and an equity multiplier of 2.5×, they're well protected when it comes to meeting their debt obligations and growing their returns without depending on just this single step either.
It’s smart enough for a manufacturing company to know how to leverage debt—growing enough to sleep well at night, too.
There is considerable nuance involved in Leverage Ratio interpretation, whereby it becomes important to assess how close to optimal a business is with regard to either growth or risk factors. It makes a considerable difference what industry it happens to be – what could be optimal for one industry could
The leverage ratio measures how aggressively debt has been used by the firm or company. Values pertaining to the debt-to-equity ratio above 2.0 or the debt ratio beyond 0.6 fall into the risk category.
A lower leverage ratio implies that it practices risk-conservative financing with more emphasis on risk management rather than rapid growth. Firms with a debt/equity ratio lower than 0.5 or a debt ratio lower than 0.3 fall under this category.
Industry characteristics fundamentally influence appropriate leverage levels. Small business owners must understand their industry norms to interpret their ratios properly.
Capital-intensive industries (utilities, manufacturing, real estate) typically maintain higher leverage ratios (debt-to-equity of 1.0-2.5) due to substantial asset requirements and stable cash flows that support debt servicing.
Asset-Light Industries (software, consulting, professional services) often operate with lower leverage ratios (debt-to-equity of 0.2-1.0) because they require fewer fixed assets and may have more variable revenue streams.
Service Industries generally fall somewhere in between, with leverage levels depending on their specific business models and working capital requirements.
The banking industry operates under unique leverage ratio requirements designed to prevent excessive risk-taking that could threaten financial system stability.
Established under Basel III, an international regulatory requirement, is that banks must keep at least a leverage ratio of 3 percent, which can be measured using the formula:
Leverage Ratio = Tier 1 Capital / Total Exposure.
Must-Have Requirements:
There are several benefits derived from using the leverage ratio that relate to regulations.
It’s easy to compute and understand; thus, banks cannot easily manipulate it with intricate risk models.
It also serves as a safety net when risk models could potentially underestimate risk.
It should be noted that there are weaknesses to using the leverage ratio, too. The leverage ratio does not differentiate between high-risk and low-risk assets; this could impair banks' incentives to hold low-risk assets.
It can also encourage banks to engage in riskier business activities to achieve returns that can underpin their capital requirements.
Leverage ratio regulations can greatly impact banking strategy and capital management.
Since banks need to balance profits with regulatory factors, this can mean more discerning lending and more emphasis on fees that don't consume capital onboard.
Leverage ratio measures are important input variables for numerous financial choices addressed to diverse stakeholders.
Leverage ratio analysis is used by CFOs for capital structure analysis and strategic planning purposes. Prior to major acquisition or expansion expenditures, CFOs analyze how their leverage ratio will be influenced by additional debt incurred or contemplated.
Suppose that a small company CFO is analyzing an equipment acquisition of $2 million. If the debt-equity ratio was 0.8 and now it would increase to 1.4 with this acquisition, there would be two aspects to consider: growth and risk.
Leverage ratios are used or incorporated into models by investors. Either aggressive growth investment or declining fundamentals can be inferred depending on the context when observing a Technology firm’s steadily increasing leverage ratio trends.
Growth investors would tolerate more leverage when dealing with firms growing in revenue markets, while value investors would require lower leverage to create cushioning when times get tough economically.
Leverage ratio trends can be analyzed by banks when considering lending or setting lending terms. A manufacturing firm with stable leverage ratio patterns close to industry averages could qualify for lower lending rates; however, if its leverage ratio patterns are increasing rapidly, higher lending rates or collateral could apply.
Decisions for loans with shorter terms of repayment involve times interest earned ratio analysis; on the other hand, debt-to-equity and debt ratio analyses dominate decisions pertaining to loans with longer repayment terms.
During M&A transactions, leverage ratios help identify integration challenges and financing requirements. Target companies with high leverage ratios might require immediate deleveraging post-acquisition, affecting deal structure and valuation.
Acquirers also consider how the target company's debt will affect their own leverage ratios and whether combined entity ratios will remain within acceptable ranges for their industry and growth strategy.
The most common mistake is comparing leverage ratios across different industries without considering underlying business model differences. A debt-to-equity ratio of 1.5 might be conservative for a utility but aggressive for a software company.
Leverage ratios can fluctuate significantly due to seasonal factors, one-time events, or accounting timing differences. Annual ratio analysis using average balances provides more reliable insights than quarterly snapshots that might reflect temporary conditions.
Traditional leverage ratios might miss significant off-balance-sheet obligations like operating leases, guarantees, or contingent liabilities. Modern accounting standards have addressed some of these issues, but analysts should still consider all forms of financial obligations.
A company with high debt levels but substantial cash reserves faces different risks than one with similar debt but limited liquidity. Net debt ratios (total debt minus cash) often provide better risk assessment than gross debt ratios.
Leverage ratios treat all debt equally, but debt characteristics matter significantly. Short-term debt creates different risks than long-term debt, and variable-rate debt poses different challenges than fixed-rate obligations.
Background: Tesla's early years demonstrate how a startup can use extreme leverage to fund rapid scaling, with debt-to-equity ratios that would terrify most CFOs—and nearly led to bankruptcy.
The Numbers (Tesla's Actual Data):
The Extreme Leverage Strategy:
Tesla’s debt/equity ratio remained above 4.0 for the majority of years, ranging between 2014-2019; hence, this implies that Tesla was using debt financing instead of equity financing for growth. By using debt financing, dilution of shareholders was avoided during the period when growth was taking place.
The High-Risk Phase:
The high leverage ratio involved taking on 4 to 8 times more debt than equity, which posed a considerable risk to finances. It would not have taken much to disrupt operations and reduce revenue at this stage because of the large debt and resultant interest payments involved.
Successful Deleveraging:
Since 2020, there has been a major improvement in the debt-to-equity ratio of Tesla, which declined significantly from 2.71 to 1.26 and continued to fall to approximately 0.68 in 2023. It can thus be inferred that the company was able to generate adequate cash flows either to reduce debt or increase equity through retained earnings.
Important Takeaway:
The debt/equity ratio trend for Tesla illustrates how aggressive startup capital structure can fuel rapid growth, but how those high leverage ratios posed sustained risks to finances that were only mitigated once the successful business model was established and cash flows improved.
Background:
Honeywell International, a diversified technology and manufacturing company, demonstrated strategic financial management by proactively reducing leverage ahead of economic uncertainty.
The Numbers (Honeywell's Actual Data):
The Proactive Strategy: Rather than waiting for economic stress to force deleveraging, Honeywell management anticipated potential challenges and began reducing debt-to-equity ratios from the 2.57 peak in late 2017. Throughout 2018-2019, they maintained ratios in the more conservative 2.0-2.4 range, demonstrating disciplined financial management during good economic times.
Crisis Navigation Benefits: When COVID-19 hit in 2020, Honeywell entered the crisis with a debt-to-equity ratio of just 2.14—significantly lower than the 2.57 peak from 2017. Although they could not anticipate this event, their low ratio helped them during this crisis. Even during the worst of the pandemic, their leverage only increased modestly to 2.63, far better than companies that entered the crisis with higher leverage.
Long-Term Positioning: By 2021-2024, Honeywell maintained stable leverage in the 2.3-2.9 range, demonstrating how proactive deleveraging provided financial flexibility for both crisis management and subsequent growth investments.
Key Lesson: Honeywell's experience shows how established manufacturers can use periods of economic strength to optimize their capital structure, positioning themselves to weather future storms while maintaining operational flexibility—a stark contrast to companies forced into reactive deleveraging during crises.
Leverage ratios translate murky financials into actionable items; however, their true power demonstrates itself when you apply these ratios and read your financials astutely.
Be it modifying your capital structure, analyzing investment opportunities, or dealing with government regulations, using leverage ratio measures helps you get objective and easy figures for making well-informed judgments.
The smartest firms make leverage ratio analysis an ongoing process rather than math for a singular purpose. It’s important because it allows you to identify trends and areas for improvement while supporting proactive efforts to stay on top while maintaining tight controls on finances.
The skill involved with hanging onto leverage analysis effectively incorporates technical know-how with good business judgment. These ratios will point you in the direction of areas that require focus, but it’s your knowledge of the drivers and market forces that will determine if you’re dealing with symptoms or problems at their root level.
Want to know if your leverage ratios are driving healthy returns or creating dangerous risk?
Understanding optimal leverage levels requires analyzing your specific industry context, growth plans, and risk tolerance.
Sometimes, the most valuable perspective comes from experienced financial professionals who can interpret leverage relationships and translate findings into actionable strategies.
Whether you need fractional CFO services for ongoing leverage analysis, interim CFO support during capital structure transitions, or strategic coaching to build internal capabilities,
McCracken Alliance helps businesses optimize their leverage strategies while maintaining financial stability.
Schedule a consultation to discover how professional leverage analysis can guide smarter capital structure decisions and improve long-term performance.


.svg)