What the debt to asset ratio is, how to calculate it, and how it reveals a company’s leverage, solvency, and financial risk profile.
What the debt to asset ratio is, how to calculate it, and how it reveals a company’s leverage, solvency, and financial risk profile.


Picture this:
You're at a dinner party, and someone asks what you do for a living. You mention you're a CFO, and suddenly everyone's eyes glaze over faster than donuts at a police convention.
But here's the thing—if you told them you're essentially a financial detective who solves mysteries about whether companies are drowning in debt or swimming in financial stability, they might actually stay awake.
That's exactly what the debt-to-asset ratio does.
It's like a financial MRI that reveals how much of your company's stuff is actually yours versus how much belongs to the bank.
And unlike most financial ratios that require a PhD in accounting to understand, this one is refreshingly straightforward—which is probably why bankers love it almost as much as they love charging fees.
The debt-to-asset ratio cuts through financial complexity, telling you in one simple number whether your company is building an empire or constructing a house of cards.
For CFOs, investors, and business owners, understanding this ratio is like having financial X-ray vision.
The debt-to-asset ratio measures what percentage of your company's assets are financed through debt rather than equity.
In other words, it answers the burning question: "If we sold everything tomorrow, how much would we owe creditors versus how much would actually belong to the owners?"
Think of it as the financial equivalent of determining how much of your house you actually own versus how much the mortgage company owns.
Except instead of just one house, you're looking at all of a company's assets—from the coffee machine in the break room to the massive manufacturing equipment that makes all the money.
This ratio provides a fundamental solvency and leverage measure that identifies the strategic balance between debt and asset capital.
The technique has a particular appeal to the lending community (who would love a glimpse into the future of whether or not they will receive their money back), investors (who would also love a glimpse into the future of whether or not they made a wise investment in a solid business or a Capitalist Tilt-A-Whirl), or a CFO.
Unlike some financial ratios that involve complex calculations in order to decipher them correctly, the debt-to-asset ratio makes a hell of a lot of sense. The debt-to-asset ratio doesn’t give a damn about your earnings quality problems or the industry crisis you may be experiencing—it simply spells out how highly leveraged you are.
The ratio also serves as an early warning system for financial trouble.
Companies with rapidly increasing debt-to-asset ratios might be heading for problems, while those with stable or improving ratios typically indicate sound financial risk management.
Here's where things get beautifully simple. The debt-to-asset ratio formula is so straightforward, you could calculate it on a napkin during lunch (which, let's be honest, probably happens more often than most CFOs would admit):
Debt to Asset Ratio = Total Debt ÷ Total Assets
That's it. No complex adjustments, no arcane accounting principles, no need to sacrifice a calculator to the financial gods.
Just find two numbers on your balance sheet and divide one by the other.
Includes all interest-bearing obligations: short-term loans, long-term debt, bonds, mortgages, and any other money you owe that charges interest. It's basically everything that makes you write checks to lenders with a slightly pained expression.
Appears at the top of your balance sheet and includes everything the company owns: cash, inventory, equipment, real estate, intellectual property, and that vintage coffee machine everyone's emotionally attached to but probably should have been depreciated years ago.
Let's analyze Netflix, the global streaming entertainment giant, using its 2024 financial data to see how debt-to-asset ratios work in practice:
Netflix's Financial Snapshot (2024):
*Total Debt = Short-term debt ($1.8B) + Long-term debt ($13.8B)
Netflix's Calculation: $15,582,804,000 ÷ $53,630,374,000 = 0.29 (or 29%)
What This Reveals: Only 29% of Netflix's assets are financed through debt, while 71% are financed through equity. This is remarkably conservative for a content-heavy business that spends over $16 billion annually on new programming.
Netflix’s debt/asset ratio of 29% is very interesting. A debt/asset ratio of 29% would seem very high for a traditional media house. But Netflix has a debt/asset ratio of 29% even when the company has invested so much in content.
Why This Matters for Netflix:
Such a cautious approach has worked well for Netflix, enabling them to overcome the challenges of economic uncertainty while investing a great deal in original productions. Leverage is very low compared to their more financially strained rivals in the industry.
Interpreting debt-to-asset ratios is like reading a financial mood ring—the numbers tell you a story, but context determines whether that story is a thrilling adventure or a horror novel.
Companies with high debt-to-asset ratios are essentially saying, "We borrowed a lot of money to buy a lot of stuff, and we're confident we can make this work."
The Good News About High Leverage:
The Bad News:
Such companies have a low debt-equity ratio; they are the financial equivalent of the person who brings an umbrella when there is a 10% chance of rain. They may forgo some aggressive growth opportunities, but have no problem sleeping at night.
The Benefits of Playing It Safe:
The Potential Downsides:
Here's where things get interesting—what's considered "high" or "low" varies dramatically by industry, like fashion trends that make perfect sense in one context and look ridiculous in another.
Capital-intensive industries (manufacturing, utilities, real estate) often operate comfortably with debt-to-asset ratios of 0.50-0.70 because they need substantial assets to generate revenue and often have predictable cash flows to service debt.
Asset-Light Industries (software, consulting, small business services) typically maintain ratios below 0.40 because they don't require massive fixed assets and often have more variable revenue streams.
Retail and Consumer Goods companies usually fall somewhere in between (0.35-0.55), depending on their inventory requirements and seasonal cash flow patterns.
These two ratios are like siblings—related but distinctly different, and each serves unique purposes in financial analysis. Understanding the difference prevents the embarrassing mistake of using the wrong ratio in the wrong context (trust us, investment bankers notice these things).
Debt-to-Asset Ratio excels when you want to understand what percentage of company resources are borrowed versus owned. It's particularly valuable for:
The Debt to Equity Ratio works well when studying the connection between debt financing and equity investment. It can particularly be applied to:
Here's a fun fact :
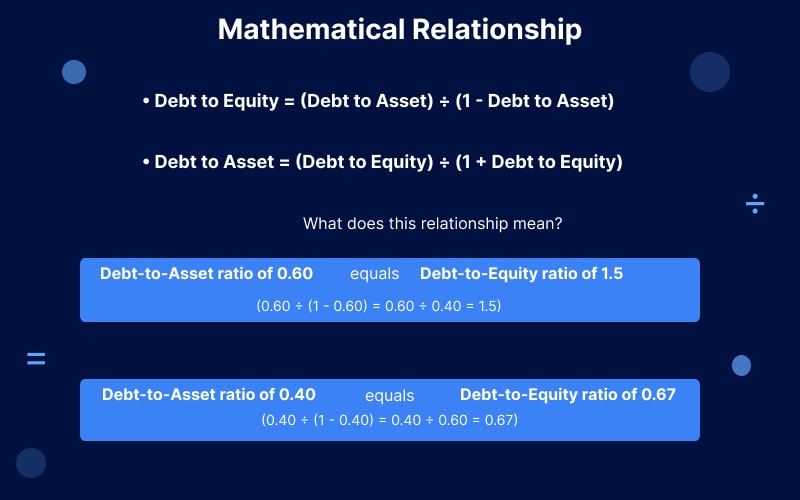
These ratios are mathematically related.
If you know the debt-to-asset ratio, you can calculate the debt-to-equity ratio (and vice versa) with a little algebra:
This relationship means a debt-to-asset ratio of 0.60 equals a debt-to-equity ratio of 1.5, while a debt-to-asset ratio of 0.40 equals a debt-to-equity ratio of 0.67.
Rather than another figure to calculate and stash in the back of one’s mind, the debt-to-asset ratio would serve more effectively as a guide to making vital business decisions.
Banks employ the debt-to-asset ratio when processing a loan request. They rely on the ratio to determine the likelihood of the debt being repaid. Additionally, they apply the measure to determine the interest rates.
A small business having a debt-to-asset ratio of 0.35 may qualify for a good interest rate. But a business having a debt-to-asset ratio of 0.75 may incur higher interest costs. The debt-asset ratio helps a lender calculate the risk of lending to the business.
CFOs employ debt-asset ratios for capital-structure optimization purposes. They analyze the effect of additional borrowing on the debt-asset ratio before making significant expansions or acquisitions.
Suppose a manufacturing business is reviewing the purchase of equipment worth $5 million.
Given the current debt-to-asset ratio of 0.45 and the new ratio of 0.62 that would be caused by the purchase, the CFO needs to balance the positive effect of growth against the negative effect on financial risk.
Investors study the debt-to-asset ratios to calculate the risk of investment. A higher debt-to-asset ratio may indicate greater potential for gains but also poses a higher risk of distress in a recession.
Growth investors may be satisfied with higher multiples for the growing revenue bases of successful expanding outfits, while value investors may target more conservative multiples that offer a buffer in more challenging times.
Many loan agreements include debt-to-asset ratio covenants that borrowers must maintain. Violating these covenants can trigger accelerated repayment requirements or additional restrictions, making ratio monitoring essential for financial risk management.
Banks and other regulated entities also face regulatory leverage requirements that use variations of debt-to-asset ratios to ensure financial system stability.
Picture this: Regional Bank Corp is evaluating a $2 million loan application from GreenTech Manufacturing. The first thing they calculate? The debt-to-asset ratio.
Current Situation:
Post-Loan Scenario:
The bank determines that 0.52 remains within acceptable limits for manufacturing companies, approving the loan with standard terms. Had the ratio exceeded 0.65, they might have required additional collateral or charged higher interest rates.
PrivateEquity Partners is considering acquiring TechSolutions Inc. for $50 million using a leveraged buyout structure. Their analysis focuses heavily on the post-acquisition debt-to-asset ratio to ensure the deal remains viable.
Pre-Acquisition:
Post-LBO Structure:
While 0.70 is aggressive, TechSolutions' stable cash flows and market position support this leverage level. The PE firm proceeds with the acquisition, planning to reduce the ratio to 0.50 within three years through cash flow generation and strategic improvements.
PublicCorp Inc. is planning international expansion requiring $20 million in additional financing. The CFO must choose between debt and equity financing while considering impacts on financial ratios and investor perception.
Current Position:
Debt Financing Option:
Equity Financing Option:
The CFO chooses debt financing, maintaining the company's conservative leverage profile while preserving shareholder ownership and benefiting from debt's tax advantages.
If your debt-to-asset ratio is making you uncomfortable (or making your banker uncomfortable, which is usually worse), several strategies can help optimize your financial structure.
Accelerated Debt Repayment:
Use excess cash flow to pay down principal balances faster than required. This directly reduces the numerator in your ratio calculation while maintaining asset levels.
Strategic Asset Sales:
Sell non-core or underperforming assets and use proceeds to reduce debt. This simultaneously decreases debt and may improve operational efficiency by focusing on core business activities.
Cash Flow Management Optimization:
Improve working capital management to generate additional cash for debt reduction. This might include faster collections, optimized inventory levels, or extended payment terms with suppliers.
Retained Earnings Accumulation:
Instead of distributing dividend payments, the earnings should be retained to augment the asset base without incurring debt. This helps to improve the ratio since the denominator also increases.
Equity Capital Injection:
Raise further equity capital to pursue further investment in purchasing assets or for further business operations. Although this causes dilution in equity, leverage ratios also improve.
Asset Utilization Improvement:
Leverage existing resources to maximize their returns. This would ensure greater profitability for more cash to retire debts or build equity.
Lower-Cost Debt Substitution:
Replace high-cost debt with lower-cost alternatives to reduce interest expenses and improve cash flow available for debt reduction.
Term Extension:
Refinance short-term debt with longer-term obligations to improve liquidity and reduce refinancing risk, though this doesn't directly change the debt-to-asset ratio.
Debt Conversion:
Convert debt to equity through debt-for-equity swaps, directly improving the ratio while reducing financial risk.
Reduce operating expenses to improve profitability and generate more cash for debt reduction or asset building.
Revenue Enhancement:
Increase sales and profitability through improved products, services, or market penetration, providing resources for debt reduction.
Capital Efficiency:
Optimize capital allocation to ensure every dollar invested generates maximum returns, improving overall financial performance.
Effective debt-to-asset management involves striking a balance between a number of competing factors, including growth, risk, profitability, and flexibility.
In a complex scenario, professional assistance in modeling different possibilities based on optimal financial structure may be required.
Specialized expertise in capital structure optimization may be obtained from the Fractional CFO without the expense of a salaried executive.
Fractional CFO services can provide specialized expertise in capital structure optimization without the cost of a full-time executive.
This can be particularly helpful for expanding companies in the midst of growth, financing options or established businesses optimizing their capital structure.
Interim CFO services prove invaluable during transitions, mergers, or financial restructuring when specialized expertise is needed temporarily.
The service of the interim CFO can be very useful in the case of transition, merger, or financial restructuring.
They also have expertise from different industries, offering a different perspective that in-house teams may not have.
Want to optimize your debt-to-asset ratio without sacrificing growth opportunities?
Understanding the optimal balance between leverage and financial stability requires analyzing your specific industry context, growth plans, and risk tolerance.
Sometimes, the most valuable perspective comes from experienced financial professionals who can model various scenarios and translate findings into actionable strategies.
McCracken Alliance helps businesses achieve the perfect balance between growth and financial stability.
Schedule a consultation to discover how professional debt ratio analysis can guide smarter financing decisions and support sustainable growth without keeping you awake at night.


.svg)