


You're sitting across from an investment analyst who has just told you that your company's stock is undervalued by 30%.
Their confidence isn't based on gut feeling or market rumors, but rather supported by a mathematical model that for over a century now, has been helping investors distinguish winners from losers.
The dividend discount model, also called DDM, is a way of valuing stock, determining its intrinsic value by calculating the present value of all the expected future dividend payments.
Simplified, it provides an answer to the basic question: "What should I pay today for a stream of dividend income that will flow to me over time?
Unlike flashier approaches to valuation that chase growth stories or momentum, the dividend discount model cuts straight to what many investors actually care about: cold, hard cash payments.
To the CFOs of dividend-paying companies and investors focused on income generation, this model is not only useful but also indispensable in making informed decisions with respect to stock value, capital allocation, and dividend policy.
The Beauty in the DDM model?
It's straightforward logic.
If you own a stock mostly for the dividends, the value of that stock should be the present value of those dividend payments back to today's dollars.
This has special relevance for established companies within sectors such as utilities, REITs, and financial services, wherein dividends form a significant part of the investment proposition.
Here's the formula, which simply captures the relationship between a current stock’s value and the future dividend expectations.
Where:
But what does each variable really mean?
Let’s break it down.
This is the expected payment of dividends that investors will make in the coming period. In firms that have a regular dividend program, this could be last year's dividend payment adjusted for growth.
To calculate more recently initiated dividends, forecasts are made based on financial forecasts and direction from management.
This is consistent with the minimum return required by investors on this stock, based on its risk rating. The minimum required return is always above risk-free (e.g., Treasury bonds), due to a risk premium that adjusts for market or firm risk.
Understanding the cost of equity calculations becomes crucial here.
This assumes the percentage by which dividends will grow annually into perpetuity.
It usually aligns with long-term growth rates (2-4%), while growing companies might sustain higher rates for shorter periods before moderating.
Essentially, this formula views the stock as a growing perpetuity, or an infinite series of dividends that grow at a constant rate.
(r-g) It is actually the 'net discount rate' adjusted for dividend growth, and that is why this model becomes highly sensitive as soon as the growth rates are close to required return values.
There are many different versions of the DDM. Essentially, they each address different methods of payment of dividends and lifecycle issues.
The simplest of the models is based on two assumptions:
The simple equation is:
P₀ = D ÷ r
This model is quite effective for firms that have stable and unchanged dividend policies, such as mature utility companies or established REITs.
For instance, assuming that a utility firm has an annual dividend of $2.00 and its required return is 10%, then its calculated value would be $20.00, since $2.00 ÷ 0.10 = ( $)$20.00
When to Use: Companies with mature business models, regulated industries, or situations where dividend growth has historically been minimal.
Named after economist Myron Gordon, this is the most commonly used DDM variation. It assumes dividends grow at a constant rate indefinitely:
P₀ = D₁ ÷ (r-g)
Imagine a bank stock with the following characteristics:
Calculation: P₀ = $3.15 ÷ (0.12 - 0.05) = $3.15 ÷ 0.07 = $45.00
This suggests the stock's intrinsic value is $45.00 per share.
In actual companies, growth is not steady and continuous. To incorporate this into its model, the multi-stage model breaks down its forecast into stages as follows:
Imagine this: A tech company is transitioning from growth stages to a more stable maturity stage, they might show 15% dividend growth for five years, and after that, a more sustainable 4% growth. The multi-stage model captures this transition way more smoothly and accurately than a model that assumes constant growth.
While this application might not be a big deal in mature or stable industries, growing companies can
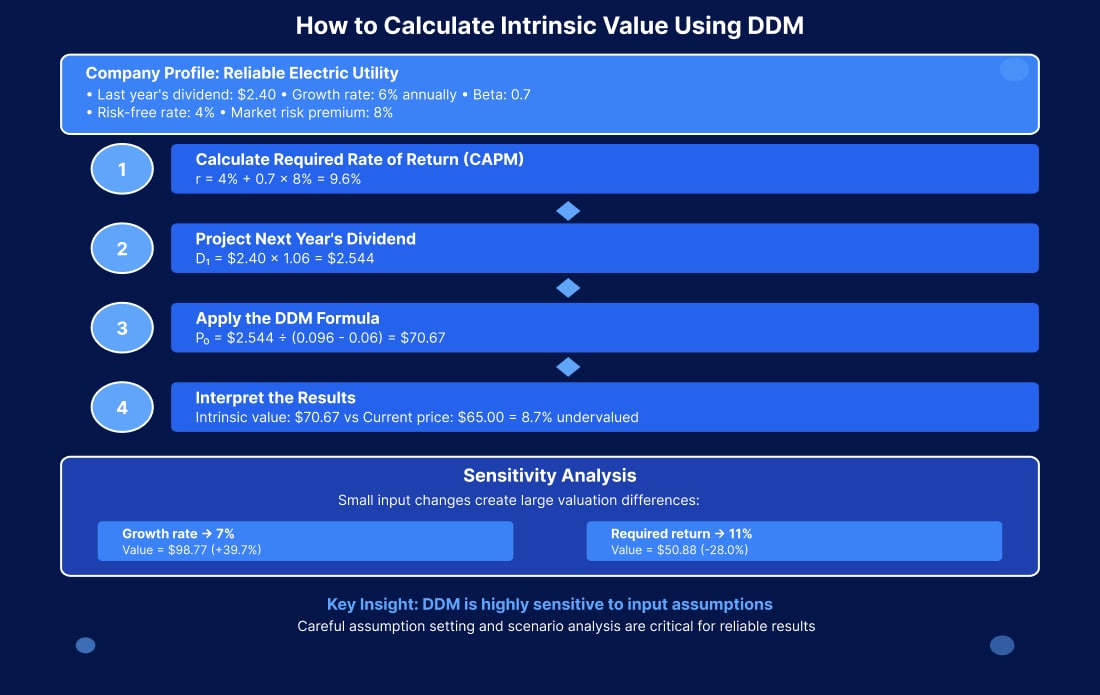
Let's go through an example of valuing a dividend-paying stock using the constant growth DDM model.
Company Profile: Reliable Electric Utility
Using the Capital Asset Pricing Model (CAPM):
Required Return (r) = Risk-free Rate + Beta × Market Risk Premium r = 4% + 0.7 × 8% = 4% + 5.6% = 9.6%
D₁ = Last Year's Dividend × (1 + Growth Rate) D₁ = $2.40 × 1.06 = $2.544
P₀ = D₁ ÷ (r - g) P₀ = $2.544 ÷ (0.096 - 0.06) P₀ = $2.544 ÷ 0.036 = $70.67
According to the dividend discount model, the value of Reliable Electric Utility is estimated at $70.67 per share. If, as of today, its price is at $65.00, this suggests that it is undervalued by about 8.7%.
DDM sensitivity to input changes can be observed through changes made to key variables:
σ_t or σ ( t )
The rate of growth accelerates to 7%:
P₀ = $2.568 ÷ (0.096 - 0.07)
Return on investment required rises to 11%:
P₀ = $2.544 ÷ (0.11 - 0.06)
Such sensitivity highlights that assumption formulation and scenario evaluation are of utmost relevance and value while employing DDM for any investment purpose.
Both DDM and DCF models value companies by discounting future cash flows, but they focus on different aspects of shareholder returns and serve distinct analytical purposes.
Choose DDM when conducting an analysis on companies based on their ability to pay dividends and investors’ primary motive is receiving dividends, it is called Dividend-Focused Analysis.
Mature and Stable Sectors:
Basically, any industry where dividends have a considerable contribution towards the total returns of shareholders.
Choose DDM when analyzing the impact of dividend policy changes on stock valuation or making capital allocation decisions between dividends and reinvestment.
Choose DCF when valuing growth companies that reinvest most earnings.
particularly in industries such as:
where dividends are minimal or nonexistent.
Choose DCF when evaluating operational efficiency, working capital management, or the impact of strategic initiatives on company value.
Choose DCF during M & A transactions, which typically focus on cash flow generation capability and not dividend policies.
It is common for sophisticated analysts to combine these two models. DDM helps identify the value of a firm as a dividend-paying investment, and DCF helps identify value creation on an operations standpoint.
By comparing these results, we can identify companies for which dividend policies could be unsustainable (where DDM value is substantially larger than DCF value) or for which they could be under-distributing funds to their shareholders (where DCF value is substantially larger than DDM value).
1. Perpetual Dividend Payments:
It is assumed that all firms pay dividends on a perpetual basis. Although this is a more realistic assumption regarding firms that have followed a dividend-paying pattern, it may not be appropriate for firms that may cut dividends during economic distress or changes of strategy.
2. Predictable Growth Patterns:
Constant growth models project dividends growing at constant rates forever, and this assumption is often violated, as firms are subject to certain cycles or pressures that may come from technological changes.
3. Stable Required Returns:
Also, this model is based on a constant required rate of return on equity, disregarding changes that may occur due to market and other considerations.
1. Non-Dividend Paying Companies:
The DDM cannot value companies that don't pay dividends, making it irrelevant for many growth companies, particularly in technology sectors where reinvestment takes priority over distributions.
2. Extreme Sensitivity to Inputs:
Small changes in growth rate or required return assumptions can dramatically alter valuations. A 1% change in either variable can swing stock values by 20-30% or more, making the model's reliability heavily dependent on input accuracy.
3. Growth Rate Constraints:
When growth rates begin to exceed or approach required returns, the model basically begins to promise unrealistic valuations or mathematical impossibilities. It usually happens to high-growth companies during expansionary periods. That's why the 2-tier model is equally important.
4. Dividend Policy Flexibility:
Companies can change dividend policies based on strategic needs, cash flow constraints, or tax considerations. The model doesn't account for this flexibility or the signaling effects of dividend changes on stock prices.
Economic Cycle Impact: During recessions, many companies cut or eliminate dividends temporarily, violating the model's continuity assumptions. Even stalwart dividend payers like banks and energy companies have reduced payments during severe downturns.
Regulatory Environment: Changes in policies, such as with recent tariffs, can affect both the attractiveness of dividend-paying stocks and companies' willingness to distribute cash versus pursuing other strategies.
Share Repurchases: Modern companies increasingly return cash to shareholders through buybacks rather than dividends. The DDM doesn't capture this alternative form of shareholder return, potentially undervaluing companies with active repurchase programs.
Effective DDM implementation requires systematic approaches that address the model's inherent limitations while maximizing its analytical value.
Rather than relying on simple historical averages, sophisticated DDM analysis incorporates multiple growth rate scenarios based on business cycle analysis, competitive positioning, and financial projections.
Advanced applications also refine required return calculations beyond basic CAPM by considering liquidity premiums, size premiums, and company-specific risk adjustments. Critical to this process is evaluating dividend sustainability through cash flow patterns, debt capacity, and capital expenditure requirements, since companies might maintain dividend payments temporarily through unsustainable means.
Sophisticated DDM applications model different growth phases corresponding to business life cycles, industry maturity, and competitive dynamics rather than assuming constant growth.
This multi-stage approach typically involves initial high-growth periods followed by gradual deceleration to sustainable long-term rates, providing more realistic valuation outcomes and supporting comprehensive sensitivity analysis for investment decision-making.
Even though this model has some flaws, it is still a useful tool that has applications for certain industries and investment methods that involve dividends.
Utilities Sector: Electric, gas, and water utility companies have relatively stable and predictable dividend policies, thanks to their regulated rate structures and stable revenue streams.
DDM is especially useful in this case because these firms normally have target ranges for dividends and usually communicate dividend growth targets as well.
Real Estate Investment Trusts (REITs):
Since REITs are required to distribute at least 90% of their taxable income as dividends, they are natural candidates for DDM modeling.
The model can be used as a tool for investors trying to determine whether or not their market price incorporates the value of future distributions from property portfolios.
Financial Services:
Many established banks and insurance companies that have a history of paying dividends embrace DDM model analysis as a mechanism of allocating capital within organizations and as a means of presenting information to shareholders on their capital plans.
Dividend Policy Setting:
CFOs rely on DDM frameworks when assessing the impact of alternative dividend strategies on stock prices.
To effectively interpret capital structures, there is a need to comprehend the implications of growth rates of dividends, required returns, and stock prices on one another.
Investor Relations Strategy:
Established public corporations that have a dividend policy incorporate DDM analysis into their presentations to convince investors of dividend policies that create value for shareholders. This comes into play especially during investor meetings, where the sustainability of dividends is often questioned.
Acquisition Analysis:
When considering dividend-paying acquisitions, the acquirer may incorporate DDM as part of its overall analysis of value, examining target firms’ dividend policies and their role in influencing value creation as part of this comprehensive analysis of value.
DDM analysis sounds straightforward until you actually try to implement it.
Understanding DDM mechanics helps CFOs evaluate how different dividend policies might affect stock valuations and the cost of equity.
This becomes particularly important when making trade-offs between dividend payments and growth investments—decisions that can make or break shareholder confidence.
You know DDM matters. You also know it's complex.
Many growing companies find themselves caught in a familiar bind:
They recognize the strategic importance of dividend valuation modeling, but lack the dedicated financial expertise to implement it effectively.
Building multi-stage DDM frameworks, conducting sensitivity analyses, and translating results into actionable dividend policies requires specialized knowledge that many finance teams simply don't have in-house.
For Investment Professionals, DDM provides systematic approaches for evaluating dividend-paying securities within income-focused portfolios, helping identify securities that offer attractive risk-adjusted returns based on sustainable dividend streams.
Understanding DDM sensitivity helps investors identify situations where small changes in business conditions might dramatically affect investment returns, while DDM frameworks facilitate sector rotation strategies by highlighting when dividend-heavy sectors become attractive relative to growth sectors.
The dividend discount model represents more than just a valuation formula—it's a strategic framework for understanding how companies create sustainable value through cash distributions to shareholders.
But here's what's seen time and again: companies understand DDM's importance theoretically, yet struggle with practical implementation.
The model's sensitivity to input assumptions, the need for sophisticated scenario modeling, and the challenge of translating results into board-ready recommendations often overwhelm internal teams already stretched thin with day-to-day financial operations.
This is precisely when bringing in a fractional CFO makes strategic sense.
An experienced fractional CFO doesn't just understand DDM mechanics—they've implemented these frameworks across multiple companies and industries. And with today's technology, this expertise can be delivered entirely virtually, giving you access to C-suite financial strategy without the overhead of a full-time executive.
The model's enduring relevance lies not in its ability to predict precise stock prices, but in its framework for thinking systematically about the relationship between current valuations, future cash flows, and required returns.
In an investment landscape increasingly focused on sustainable, cash-generating businesses, these fundamental relationships remain as important today as when the model was first developed.
The difference between companies that leverage this understanding effectively and those that don't often comes down to having the right expertise when it matters most.
Ready to turn DDM theory into a strategic advantage?
Calculating or approximating this value is often considered to be more complex
The general formula for DDM is P₀ = D₁ ÷ (r-g). Here, P₀ is today’s stock price, D₁ is the expected dividends for the coming year, r is the rate of required return, and g is a stable growth rate of dividends. It is used for the constant growth rate model of DDM, or the Gordon growth model.
To value a stock based on DDM, one has to:
(1) Estimate the dividend payment for next year, (2) Estimate the rate of return from CAPM or other techniques, (3) Estimate the growth rate of dividends, (4) Use the formula P₀ = D₁ ÷ (r - g), and (5) Compare this calculated value with that of the market price of today’s stock.
Actually, the Gordon Growth Model is a specific model of DDM that applies a perpetual rate of dividend growth. The Category of DDM would be any model that applies growth, two of which are zero-growth, and one of these is called 'Gordon growth' or constant growth, and 'Multi-stage'.
Some of the major flaws and issues present within the model are as follows:
only applies if companies pay dividends, highly susceptible to changes within growth rate or rate of return, presumes that companies pay dividends forever, does not consider share buybacks, and has difficulty handling irregular or unpredictable dividend policies.
True, DDM is still used today, especially when assessing investment opportunities that involve dividends, such as utility, REIT, and financial service companies. Although it is not applicable when it comes to growth firms that don't distribute dividends, it is still helpful for income investors and firms that have adopted a dividend policy.


.svg)