


Earnings per share represents one of the most scrutinized numbers in corporate finance—a deceptively straightforward calculation that reveals how much net income a company generates for each share of outstanding stock.
This single metric wields outsized influence in investment decisions, analyst reports, and executive compensation discussions, often determining whether CEOs sleep soundly or toss and turn after earnings calls.
Most business leaders understand EPS conceptually but struggle with its strategic implications.
When you're running a growing company, it's easy to get intoxicated by revenue growth and forget that investors are equally concerned with how efficiently you're converting that growth into per-share value.
This disconnect between operational success and market perception can create unnecessary volatility in your company's valuation—and some uncomfortable board meetings.
Earnings per share functions as the financial world's universal translator for profitability—a metric that transforms complex business operations into a single, comparable number that investors actually understand.
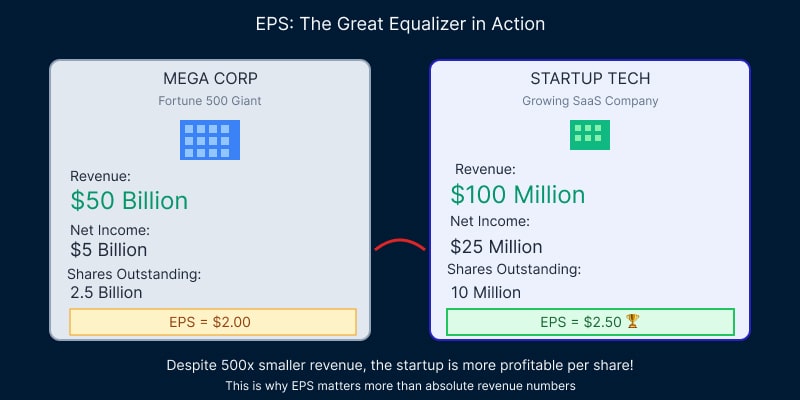
Rather than comparing absolute dollar amounts, which vary dramatically between a $10 million startup and a $10 billion corporation, EPS normalizes earnings on a per-share basis, enabling meaningful comparisons across companies of vastly different sizes.
EPS is the great equalizer - as a metric, it allows you to compare a scrappy tech startup against Apple on the same terms, measuring pure profitability efficiency rather than getting distracted by the sheer scale of revenue numbers.
This key profitability metric serves multiple constituencies across the financial ecosystem.
rely on EPS to evaluate company performance because it directly connects profitability to shareholder value in a way that cuts through the noise of revenue headlines and operational complexity.
Track EPS trends religiously to understand how operational decisions translate into market perception,
Use EPS as the foundational building block for valuation models and investment decisions.
Your EPS tells a story about management efficiency, capital allocation decisions, and long-term value creation that resonates far beyond your quarterly earnings call.
When investors see consistent EPS growth, they're witnessing proof that leadership can scale profitability alongside revenue expansion without losing their minds (or their margins).
Now that we see the Strategic impact of EPS, let’s dive into the formula.
The basic earnings per share calculation follows a straightforward formula:
Basic EPS = (Net Income - Preferred Dividends) ÷ Weighted Average Shares Outstanding
Want to see a real world example?
A company reports $2.5 million in net income with no preferred dividends and 1 million weighted average shares outstanding. The basic EPS calculation would be:
EPS = ($2,500,000 - $0) ÷ 1,000,000 shares = $2.50 per share
The weighted average shares outstanding accounts for timing differences when companies issue or repurchase shares during the reporting period.
If a company starts the year with 800,000 shares and issues 400,000 additional shares halfway through the year, the weighted average would be 1,000,000 shares—not 1,200,000.
This is where having experienced financial leadership becomes critical—and where many companies learn expensive lessons.
The EPS calculation might look simple, but the underlying components require sophisticated judgment calls around revenue recognition, expense timing, and share count methodology.
Small errors in these foundational elements can significantly distort your reported EPS and, consequently, send your market valuation on an unwanted roller coaster ride.
Financial reporting requires companies to present both basic and diluted earnings per share, each serving different analytical purposes:
Diluted EPS calculation incorporates the treasury stock method for stock options and the if-converted method for convertible securities.
This creates a more conservative earnings per share figure that reflects the potential impact of dilutive securities on existing shareholders.
The difference between basic and diluted EPS reveals important information about a company's capital structure complexity.
A significant gap between basic and diluted EPS suggests substantial dilutive securities outstanding, which could materially impact future shareholder value.
Most growing companies underestimate the diluted EPS impact of their equity compensation programs—often with painful results.
This is especially important during fundraising conversations, where sophisticated investors will focus heavily on your diluted share count and its trajectory with the intensity of a forensic accountant at a tax audit.
Ok, so evidently you want your company to have a strong EPS. Stronger then competitors, definitely. But other then for metrics sake, why should EPS matter so much?
Earnings per share drives investment decisions because it directly connects company performance to shareholder returns.
Stock prices often move in response to EPS announcements, with companies that beat analyst EPS expectations typically seeing share price increases, while those missing EPS targets face selling pressure.
The price-to-earnings (P/E) ratio, one of the most widely used valuation metrics, depends entirely on EPS for its calculation.
A company trading at 20x P/E with $2.50 EPS has an implied stock price of $50 per share.
When EPS grows to $3.00, the same P/E multiple suggests a $60 stock price—a 20% increase driven purely by earnings per share improvement.
Investment analysts use EPS to compare companies across different industries and market capitalizations.
A $100 million company with $1.50 EPS can be meaningfully compared to a $10 billion company with $1.50 EPS, despite the dramatic difference in absolute scale. They both have the same EPS.
This standardization explains why EPS carries such weight in investor communications—it's the closest thing finance has to a universal language.
When you're presenting to potential investors or existing shareholders, your EPS trend tells a more compelling story than revenue growth alone.
Investors want to see that management can convert top-line growth into bottom-line results that benefit shareholders directly, not just create impressive-looking revenue charts that would make a marketing team proud.
Earnings per share forms the foundation for multiple valuation methodologies and financial metrics.
The price-to-earnings ratio, calculated as stock price divided by EPS, represents the most common valuation multiple across public and private markets.
Financial modeling relies heavily on EPS projections to estimate future company value.
Discounted cash flow models, comparable company analyses, and precedent transaction studies all incorporate EPS trends to assess investment attractiveness and determine appropriate valuation ranges.
EPS growth rates influence investor expectations and analyst recommendations.
Companies demonstrating consistent EPS expansion typically command premium valuations, while those showing EPS volatility or decline face increased scrutiny and potentially compressed multiples.
Here's where most business leaders miss the mark :
EPS directly impacts your cost of capital in ways that would make your bank loan officer smile.
Companies with strong, predictable EPS growth can access debt and equity financing at more favorable terms because lenders and investors perceive lower risk.
This creates a virtuous cycle where strong EPS performance reduces financing costs, which further improves profitability and EPS—like a financial flywheel that actually works in your favor.
So you see how EPS can really give your company an edge in so many investment scenarios?
It's opening doors that revenue metrics alone simply can't unlock.
So how can you positively impact your earnings per share while building sustainable long-term value?
Well,
Several operational and financial factors can significantly impact earnings per share, both positively and negatively:
Revenue growth, margin expansion, cost management, and operational efficiency directly affect the numerator in EPS calculations. Companies can improve EPS by increasing profitability through either top-line growth or bottom-line optimization.
Share buyback programs reduce the denominator in EPS calculations, automatically increasing EPS even without earnings growth. Conversely, new share issuances for acquisitions, employee stock programs, or capital raises increase the share count and dilute EPS.
Companies with preferred stock must subtract preferred dividend payments from net income before calculating EPS available to common shareholders. Changes in preferred dividend rates or preferred share outstanding can affect EPS calculations.
One-time gains or losses on the P&L , restructuring charges, and non-recurring items can create EPS volatility that doesn't reflect underlying business performance. Many companies report adjusted EPS figures that exclude these items to provide clearer operational insights.
The challenge most growing companies face?
Balancing EPS optimization with long-term growth investments without sacrificing their future on the altar of quarterly results.
Aggressive cost-cutting can boost short-term EPS but damage competitive positioning faster than you can say "penny wise, pound foolish."
Share buybacks can artificially inflate EPS while starving the business of growth capital.
The key is finding the right balance between immediate EPS improvement and sustainable value creation—a tightrope walk that would make circus performers nervous.
Here's where experienced financial leadership makes the difference between sustainable EPS growth and short-term manipulation.
Many growing companies find themselves caught between investor pressure for EPS improvement and the operational reality of scaling a business.
This is precisely when bringing in seasoned expertise can transform your approach from reactive to strategic.
An interim CFO can step in during critical periods to help companies navigate complex EPS optimization challenges.
These experienced executives typically focus on identifying sustainable profit improvement opportunities, implementing robust financial controls, and establishing EPS tracking systems that provide meaningful insights rather than just meeting quarterly targets.
Unlike permanent hires, interim CFOs can tackle specific EPS-related projects with surgical precision—whether that's restructuring operations for better margins, optimizing capital allocation decisions, or preparing financial systems for upcoming funding rounds where EPS trends will be heavily scrutinized.
For companies not ready for interim leadership but needing ongoing strategic guidance, a fractional CFO can provide the expertise to build long-term EPS improvement strategies.
Fractional CFOs excel at developing financial projections that balance EPS optimization with growth investments, implementing cost management systems that improve margins without damaging competitiveness, and establishing financial reporting processes that accurately communicate EPS trends to stakeholders.
The expertise gap becomes particularly evident when companies attempt to optimize EPS without understanding the interconnected nature of financial metrics.
Working capital management, cash flow optimization, and operational efficiency improvements all influence EPS, but require sophisticated financial acumen to implement effectively.
Without this expertise, companies often make decisions that boost EPS in the short term while creating long-term operational problems or stunting growth potential.
Ready to optimize your company's EPS strategy?
Understanding earnings per share is just the beginning—implementing sophisticated financial planning that balances EPS improvement with long-term growth requires experienced guidance.
Whether you need fractional CFO support to establish robust EPS tracking or interim leadership during critical growth phases, the right financial expertise can transform how investors perceive your company's value creation potential!
Frequently Asked Questions
EPS quality depends on industry context, company size, and growth stage. A mature company with stable $5.00 EPS might be excellent, while a high-growth startup with $0.50 EPS could represent strong performance. Focus on EPS trends and growth rates rather than absolute numbers.
Revenue represents total sales generated by a company, while EPS shows how much profit each share of stock earned. A company can have growing revenue but declining EPS if costs increase faster than sales or if share count expansion outpaces earnings growth.
EPS changes based on net income fluctuations, share count variations, preferred dividend payments, and accounting adjustments. Operational improvements, cost management, share buybacks, and capital structure decisions all influence EPS results.
Yes, companies report negative EPS when net losses exceed any preferred dividends. Negative EPS indicates the company lost money during the reporting period, which typically pressures stock prices and raises questions about business sustainability.
Stock splits proportionally reduce EPS while increasing share count. A 2-for-1 stock split doubles outstanding shares and halves EPS, but doesn't change the underlying economic value. Historical EPS figures are adjusted retroactively to maintain comparability.


.svg)