


The question haunts every business owner: "When will we actually start making money?"
Whether you're staring at a startup's cash burn rate or managing an established company's new product launch, break-even analysis provides the mathematical clarity that cuts through financial fog.
It's not just accounting.
It's strategic intelligence that determines whether your business model works or needs serious recalibration.
Break-even analysis identifies the precise sales level where total revenues equal total costs.
It's the magical point where your business stops hemorrhaging money and starts generating profit.
Below this point, every sale brings you closer to profitability; above it, every sale drops straight to your bottom line.
This fundamental tool serves as the foundation for virtually every major business decision.
And so many other financial aspects of a business.
This analysis is able to transform abstract mathematical or financial concepts into concrete, actionable targets and insights that drive daily operations and long-term strategy.
The break-even point represents more than just financial equilibrium—it's the moment when your business model proves its viability.
For startups, it's the difference between raising another funding round and achieving sustainable growth. For established companies, it's the benchmark that validates new initiatives and expansion plans.
The core break-even formula:
Break-Even Point (in units) = Fixed Costs ÷ (Price per Unit - Variable Cost per Unit)
It is also sometimes expressed as:
Break-Even Point (in units) = Fixed Costs ÷ Contribution Margin per Unit
To calculate break-even in dollars, multiply the unit break-even by your selling price per unit.
Before engaging with the math involved, these components can be understood together:
Contribution Margin: It’s the fuel that drives profits: every contribution margin dollar can help cover expenses.
Every unit of sales will increase the amount that can be applied towards covering fixed expenses. After meeting fixed expenses, every unit will go directly into profit.
Let's check out a real-world Breakeven Scenario.
Given:
Break-Even Calculation:
$50,000 ÷ $150 = 334 units monthly
In revenue terms:
334 units × $200 = $66,800 monthly
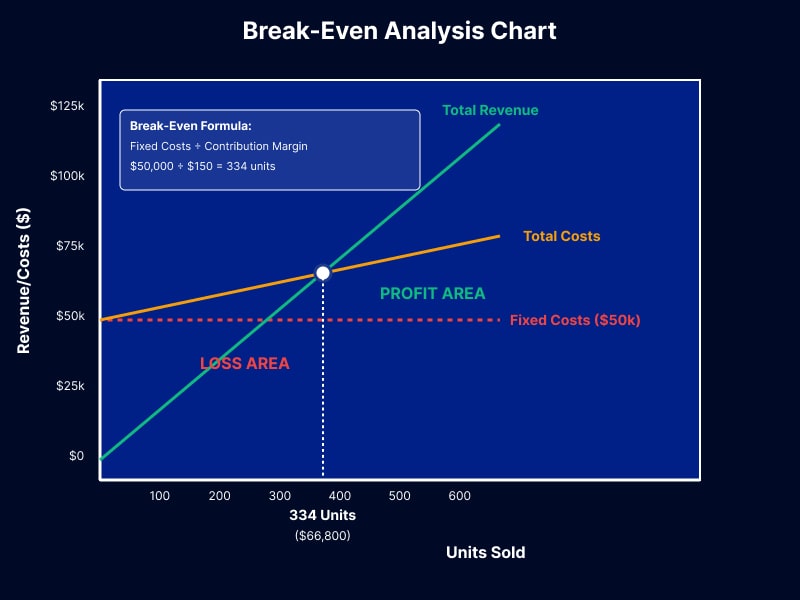
As units sold increase, total revenue grows at $200 per unit while total costs rise more slowly at only $50 per unit (since fixed costs stay constant). The gap between these two lines represents either losses (when costs exceed revenue) or profits (when revenue exceeds costs).
This company must sell 334 units monthly to cover all costs. Just to cover its costs. Not to be profitable.
Unit 335 and beyond generate pure profit! (assuming the cost structure remains constant)
Accurate break-even analysis demands precise cost classification. And in a modern-day business environment, costs tend to get mixed. However, here is the breakdown for most of the common costs :
They remain constant regardless of sales volume:
These costs persist whether you sell one unit or one thousand - they stay the same. Which means? They decrease on a per-unit basis with the more units you sell (not withstanding needing more of them to produce more)
Double your sales, and these costs double proportionally. One more unit of product will use x amount more raw materials, more commission etc. There isn't much getting around this.
Compared to other fixed costs, variable expenses don't offer large economies of scale. Manufacturing more will probably get you a slightly better deal on your materials or perhaps lower shipping costs; however, you'll still need more or less the same amount of materials regardless of if it's your 10th item or your 10,000th item produced.
The actual headache occurs when considering mixed expenses with variable and fixed components. For example, utility company expenses: basic service charges (fixed) and charges depending on consumption (variable). There’s the payroll aspect with base pay (fixed) and bonuses depending on performance (variable).
They misallocate expenses; this messes with break-even analysis. For example, a manufacturing company could treat total labor expenses as fixed, excluding variable labor related to production growth due to part-time or evening workers. Companies providing services could underestimate the increasing expenses associated with variable technologies, depending on service volume.
And don't even get started on prepaid expenses. These can introduce fictitious timing distortions—because software licenses are prepaid every year, they appear variable when they're not; or when equipment expenses are prepaid over several periods when they should just be recorded as fixed expenses one time only.
The solution would be to examine cost behavior thoroughly. Study how expenses vary with activity level changes. Costs that remain absolutely fixed can be labeled true fixed costs. Costs that vary directly with sales volume can be labeled purely variable costs. Any other cost would need to be separated into fixed and variable components.
Contribution margin—the difference between selling price and variable costs—drives break-even analysis and profitability planning. It represents the amount each unit contributes toward covering fixed costs and generating
It's Revenue after variable cost.
The contribution margin ratio (contribution margin ÷ selling price) reveals profitability efficiency. A 75% contribution margin ratio means every dollar of sales contributes 75 cents toward fixed costs and profit, with 25 cents consumed by variable costs.
This metric guides pricing decisions, product mix optimization, and cost management priorities. Products with higher contribution margins deserve marketing emphasis and operational focus. Low-margin products may require price increases, cost reductions, or strategic elimination.
Break-even analysis extends beyond profitability to target profit planning. The modified formula becomes:
Required Sales Units = (Fixed Costs + Target Profit) ÷ Contribution Margin per Unit
If our software company targets $20,000 monthly profit, the required sales increase to 467 units [($50,000 + $20,000) ÷ $150]. This analysis guides sales targets, marketing budgets, and operational planning.
Margin of safety measures the cushion between actual sales and break-even sales, expressed in units, dollars, or percentages. A company selling 500 units monthly with 334 break-even units has a 166-unit margin of safety (33% margin of safety).
This basically indicates a risk tolerance level coupled with operational flexibility. Higher margins of safety are going to provide a buffer against market downturns, any competitive pressure, and any unexpected cost increases.
Break-even sensitivity analysis explores "what-if" scenarios involving cost changes, pricing adjustments, and volume fluctuations. How would a 10% rent increase affect break-even? What if variable costs decreased by 15%? Sensitivity analysis quantifies the impact of various scenarios on profitability.
Break-even analysis establishes minimum pricing floors below which sales contribute negatively to profitability. However, strategic pricing often involves temporary below-break-even pricing for market penetration, competitive positioning, or customer acquisition.
The key lies in understanding the long-term contribution margin implications and ensuring adequate resources to sustain below-break-even operations until strategic objectives are achieved.
Break-even analysis can demonstrate how cost reductions impact profit. Reducing fixed costs directly reduces break-even points; however, decreasing variable costs increases contribution margins. By decreasing your fixed costs $5,000 per month, your break-even point would reduce by 33 units under our software example ($5,000 ÷ $150).
Capital investments often involve upfront costs that increase fixed expenses while potentially reducing variable costs or increasing capacity. Break-even analysis helps evaluate whether increased sales volumes justify higher fixed costs.
The largest pitfall is to treat step-fixed costs either purely as fixed costs or purely as variable costs. For instance, supervisory salaries would vary depending on production volume, as more supervisory help may be required when production volume rises. “To properly classify expenses,” you gotta know how your costs will behave over the ranges related to activity.”
In basic break-even analysis, it’s assumed that you can produce and sell as much as you like with no limit. In real life, however, you'll soon find that you've reached capacity limitations such that you'll need additional investment of fixed costs at certain levels of production. For example, if you own a manufacturing company, you'll need additional equipment or facilities beyond a certain level of production.
Break-even analysis provides snapshots based on current cost structures and market conditions. Dynamic markets require regular updates reflecting competitive changes, cost inflation, and evolving customer preferences.
Look, let's be honest here: most finance teams calculate break-even once during budget season and forget about it. That's like checking your GPS at the beginning of a road trip and never looking at it again. Markets shift, costs creep up, and competitive dynamics change—your break-even analysis should evolve accordingly.
Extended break-even calculations spanning multiple years should incorporate time value of money considerations. A three-year break-even period looks different when discounted cash flows are considered versus simple arithmetic calculations.
Startups use break-even analysis to determine funding requirements and runway calculations. Understanding the path to profitability helps negotiate investor terms and plan milestone achievements.
A tech startup with $50,000 monthly burn rate and an 18-month runway must achieve break-even within that timeframe or raise additional funding. Break-even analysis guides product development priorities, marketing investments, and operational scaling decisions.
While companies assess plans to introduce new products into their markets, they rely on break-even analysis when determining viability and resource allocation. They assess development expenses, advertising budgets, and operational costs against contribution margins and sales volume expected.
Geographical or market expansion would mean additional fixed costs and uncertain market demand. Break-even analysis can be used to test an expansion idea or determine market performance measures for expanded markets.
Process improvements, technology investments, and organizational changes affect cost structures and break-even points. Analysis guides investment priorities and measures improvement effectiveness.
Significant cost structure changes demand break-even recalculation. New facility leases, technology investments, or organizational restructuring alter fixed costs. Supplier changes, process improvements, or automation affect variable costs.
Competitive pricing pressure, market saturation, or economic conditions may require pricing adjustments or cost structure modifications. Break-even analysis guides strategic responses to external pressures.
Business growth often involves step-function increases in fixed costs. Additional staff, larger facilities, or expanded infrastructure create new break-even dynamics that require updated analysis.
If you're still using break-even calculations from six months ago, you're probably making decisions based on outdated assumptions. The most sophisticated CFOs treat break-even analysis as a living document that evolves with their business.
To get break-even analysis correct, you need to schedule your reviews to fit your planning schedule. For example, if your business environment is constantly dynamic, you can choose to conduct your reviews every month; if not, every quarter would work well.
It’s important to create an ongoing process that catches trends and ideas related to cost movements, market sentiment, and how you run your business that disrupt your break-even calculations.
Bottom line:
Break-even analysis is more than just finding that magic figure at which you break even or stop losing money. It’s more about grasping those financial levers which drive your business. Get this right, and you stop just reacting to your finances to start planning your business.
Sometimes, an outside perspective from seasoned financial professionals can identify blind spots in your analysis and optimize your path to profitability. The investment in proper break-even analysis pays dividends in strategic clarity and operational efficiency.
Reach out to McCracken Alliance - it could make or break your next growth phase!


.svg)